Range maps are vital tools that illustrate species’ geographic distributions. They show where species are found and may distinguish between various types of ranges.
These maps are crucial for research, conservation, and birdwatching. However, there are various types of range maps, and some are more accurate than others. Let’s take a look at what types of range maps there are, their features, and where you can find them.
Bird Range Maps & Their Data
Range maps are essential tools used to visually represent the geographic distribution of species. There are various types of range maps for different purposes.
Basic static range maps, commonly found in field guides, provide a general overview of where you can see the species.
They may distinguish between breeding, non-breeding, year-round, migration, and other types of ranges using various markings, such as different colors in different intensities to also indicate how common or uncommon they are in those areas.
Dotted lines on these maps may denote irregular range extensions, caused by factors like food scarcity or extreme weather.
New advancements include dynamic range maps that update based on recent bird sightings, offering real-time distribution data. These maps help scientists, conservationists, and birdwatchers understand species’ movements, habitat requirements, and population trends, aiding in effective conservation and management efforts.
Here is an overview of some common birding sites and the types of range maps they offer.
eBird
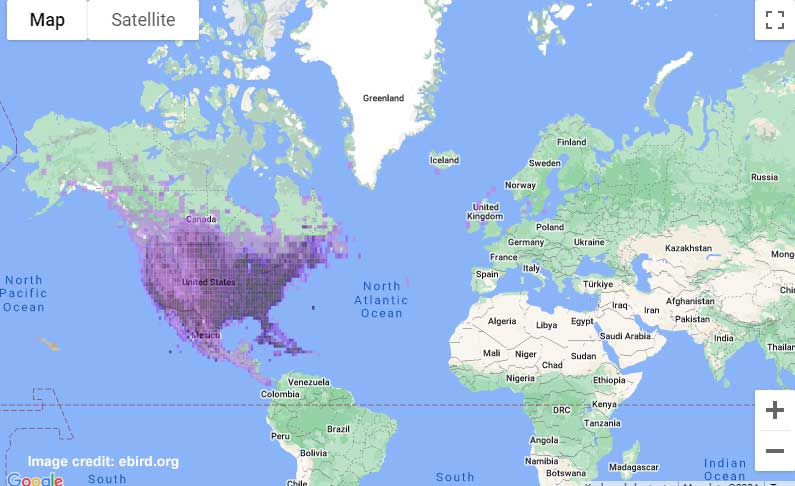
eBird range maps offer a comprehensive overview of the range and abundance of bird species based on reported sightings. These maps are highly detailed and provide insights into seasonal movements and population dynamics. There are four types of maps.
Users can access fairly traditional basic range maps that show year-round, breeding, non-breeding, pre-breeding, and post-breeding ranges. Additionally, weekly abundance maps show relative population levels throughout the year, capturing seasonal fluctuations and migration patterns.
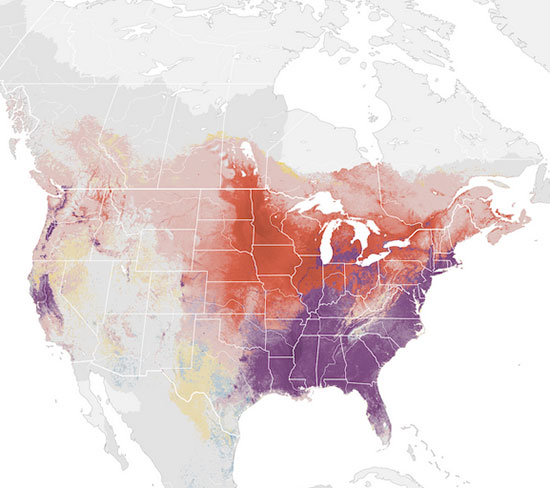
Seasonal abundance maps highlight average population densities across different phases of a species’ annual cycle. Trend maps display changes in relative abundance over the past decade, aiding in the assessment of population trends. They show where bird populations have increased or decreased.
These innovative range maps reveal nuanced relationships with landscape features and reveal seasonal occurrence patterns with precision, making them valuable tools for research, conservation, and birdwatching.
IUCN
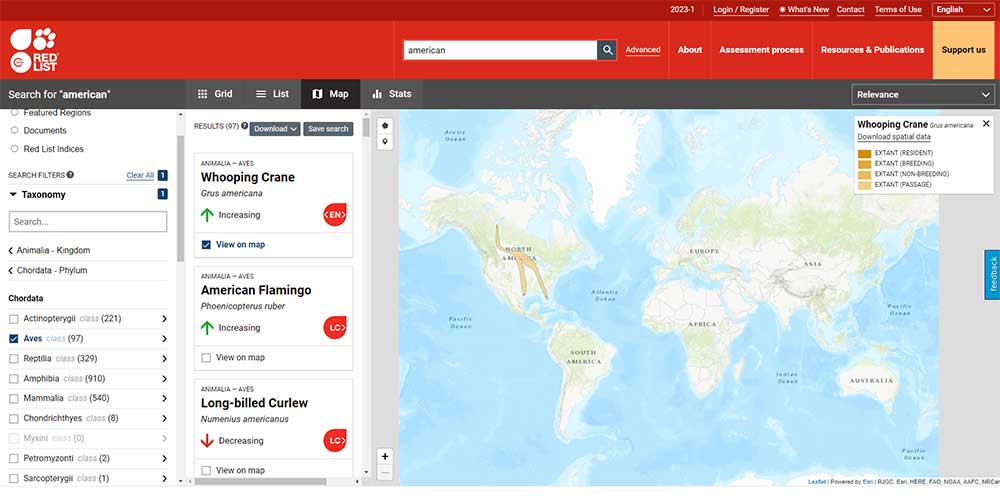
The range maps provided by the IUCN Red List depict the whole world and offer a comprehensive yet very rough overview of the areas the birds inhabit.
You can search by specific species and look at the range map in their profile. Alternatively, you can also open the map function and search by different specifications such as taxonomy, category, land and marine regions, and even threats and more.
These maps, however, do not differentiate between specific seasonal or migratory patterns such as wintering, breeding, year-round residency, or migration routes.
However, they have 27 different options to describe the exact nature of it. The categories used to describe their range are extant (meaning alive), possibly extant, possibly extinct, extinct, or presence uncertain. This, in turn, can be combined with further specifications such as assisted colonization, introduced, origin uncertain, reintroduced, vagrant, and resident.
Birds of the World
Birds of the World aims to provide accurate and up-to-date range information for every species. However, the type of range map provided on the bird’s profile is not always the same.
Their most common map is a basic range map, which offers a rough overview of where a species occurs, including its year-round, breeding, non-breeding, and migratory range. Their goal is to have one for every species.
Where a basic range map, for whatever reason, is not available, they have featured eBird’s seasonal abundance maps, which we discussed more in-depth above.
Are bird range maps always accurate?
Although everyone says bird range maps are more accurate than ever, they are never 100% accurate. While traditional range maps in field guides provide a general overview of a species’ distribution, they can be limited by the data available at the time they were created.
However, the development of citizen science projects like eBird has allowed for the creation of more detailed and up-to-date range maps powered by analytical models and a large database of bird sightings. These new maps capture fine-scale patterns and seasonal changes in a species’ range that was previously unknown.
That said, the eBird range maps can still contain some errors, either by predicting species presence in areas where they don’t actually occur, or vice versa. This is because the predictive models rely on the available eBird data, which may have gaps in certain regions or seasons.
So, in summary, while bird range maps are becoming more accurate and dynamic thanks to data collected from people’s sightings, they are not perfect and require ongoing maintenance and improvement. However, they represent a significant advancement over traditional static range maps.
Keep reading: Are range maps accurate & when are they updated